Asset Analysis and Financial Models for Geodesignhub
Using this plugin you can build and develop financial scenarios for your schemes negotiated in Geodesignhub.
- Make capital investment decisions and investment / maintenance strategies
- Develop life-cycle cost analysis and link them to capital allocation decisions
- Identify risks and returns for your assets
- Consolidate / repurpose or develop strategies for repair / reuse of existing buildings
Table of Contents
Introduction
This plugin enables comprehensive financial and asset analysis for your Geodesignhub projects. It uses the Geodesignhub API to download data from your project and provide a series of controls to analyze and set potential uses of this asset, conduct financial Analysis and finally conduct a investment summary. Using the data import / export feature you can take the model data out and generate and load different financial scenarios. This way, you can quickly make sense of financial data, prepare for future risks and proactively manage assets using digital tools.
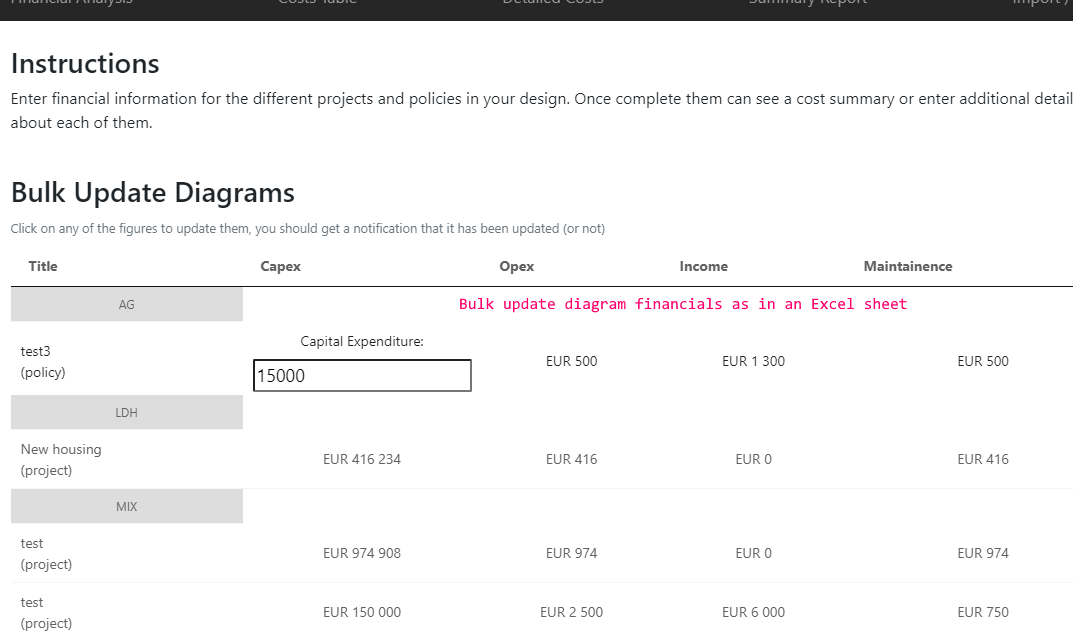
Bulk update Financial Details
A design has number of diagrams and you can set / update basic financial data for a design in a Excel like user interface.
Financial Analysis
This module helps you refine and understand the Financial Information associated with the diagram. It is focused on the capital investment expected return of investment by doing a “Net Present Value” analysis on the diagram.
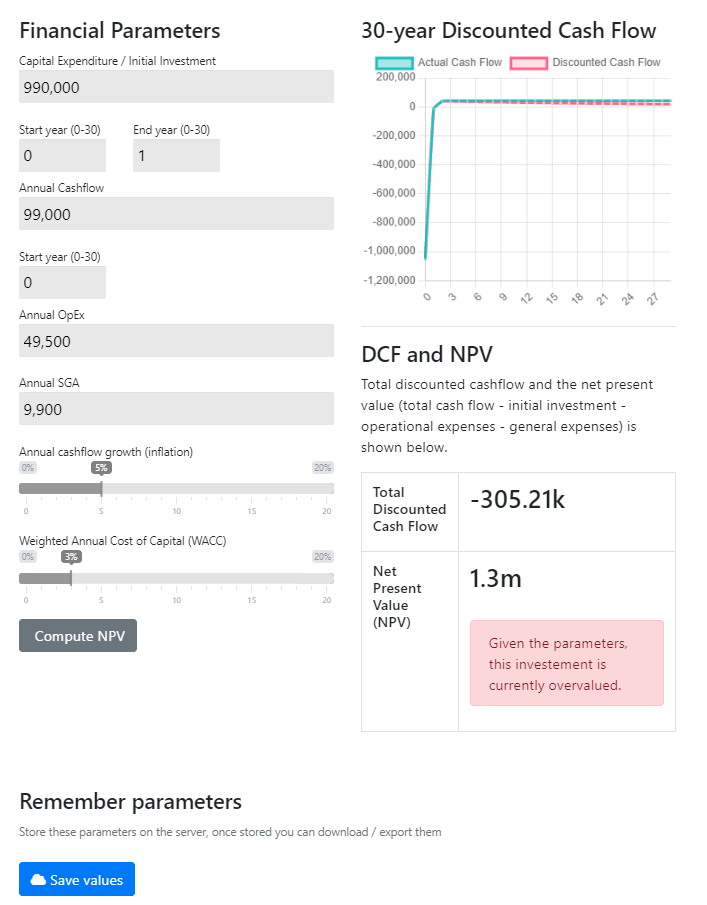
You can enter the following parameters:
- Capital Expenditure / Initial investment needed to build the asset.
- Start year for the investment and the end year which is the time it will take to build the asset.
- Expected Annual Revenue once the asset has been built.
- Annual Operating expenditure to run the asset e.g. in employee salaries, fees, taxes etc.
- Annual SGA (Sales, General, and Administrative Expenses) associated with the asset.
- Expected cashflow growth generally inflation or you can set any percentage e.g. if you expect the prices to increase by 5%.
- Finally Weighted Annual Cost of Capital (WACC) is the rate at which you can get a loan for your investment, normally these are interest rates or a number higher than the current interest rate.
You can then calculate the Net present value of your investment and the 30 year discounted cash flow. Finally you can save these details.
Asset Analysis
Using this part of the plugin, you can set specific characteristics of a diagram based on the intended use. Details such as people housed, total units and number of floors for a example for a residential diagram, as shown below.

In addition you can set a representative image and compute targetted population density. There are other asset types as well such as Tourism, Office, Retail etc. available as well. As we progress, we will continue to add additional asset classes.


After having set the asset class and the intended use of the diagram, this module can then compute the services requried for that asset to maintain

Investment Analysis Library
This is the third module of the plugin. Once you have set the asset details and the financial analysis set for a diagram, this module summarizes them and conducts builds a series of visualizations.
This module analyzes the location of the diagram over the boundary uploaded into Geodesignhub. A boundary is a simple polygon file that can be really any boundary: social, political, economic or administrative. Once the boundary is uploaded, the plugin computes the asset details over that boundary. This is useful to visualize how money flows in the design over time and space.
Boundary Analysis
Investment over time per boundary, once the capital investment is set, you can then compute how the investment flows over different boundaries. Below is a chorpleth intensity map of investments demonstrating the across various boundaries.
 Also as a simple chart.

Once intervention strategy is finalized, all the asset details “rolled up” in one list with all the totals.

Finally the plugin splits the allocations proportionally across different boundaries so you can see how the distribution of jobs, visitors, population and services are split across the different boundaries.


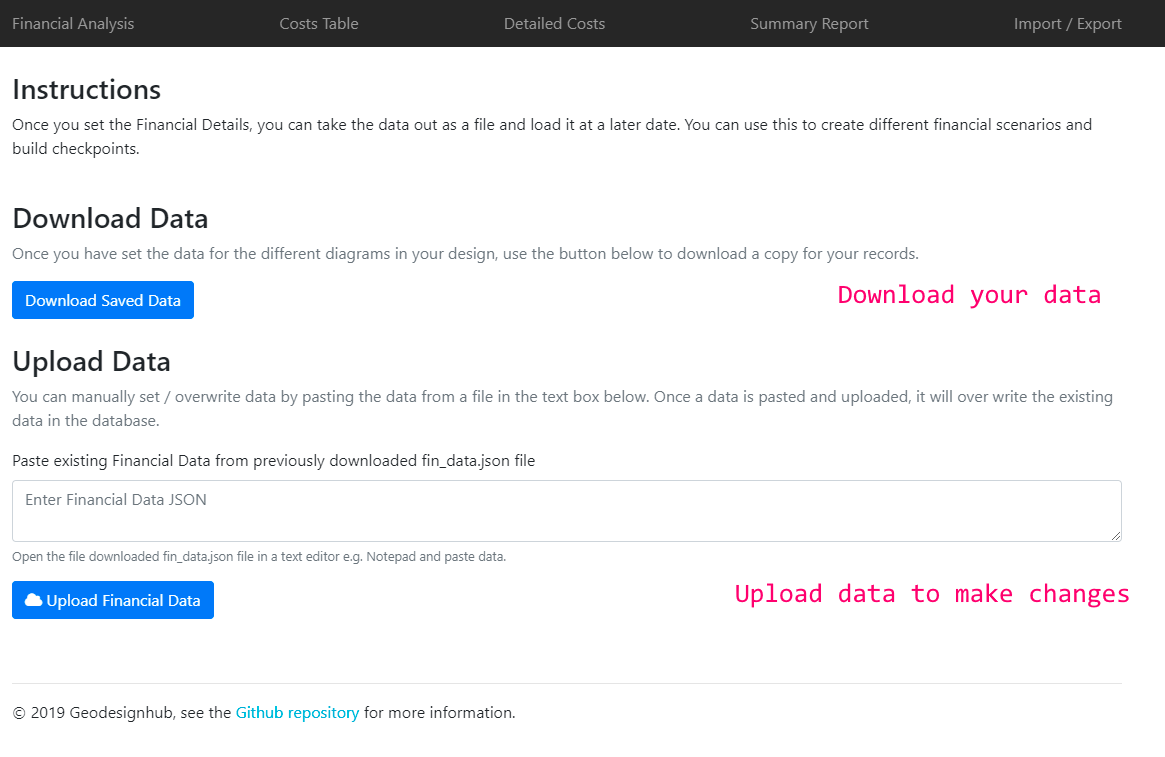
Financial Scenarios Import / Export data
You can set the model / data parameters to take it out of the system. Then you can tweak the parameters and create financial scenarios for analysis. You can then store the data as a file for your records and load it again for the analysis.
Adding the plugin
The plugin can be added to your project using the Administration panel